What is a trend?
- This is the direction of movement of the price of an asset, which was formed within a certain time period. Often, the term "trend" is used as a synonym for this concept, which can be formulated as the most probable direction of price movement in the future, determined on the basis of its previous and current state. In both cases, directionality is the key, which is the most important aspect of forecasting price movements and trading in general. Its purpose is to make a profit based on the change in the value of an asset in a pre-selected direction.
One of the fundamental laws of technical analysis says that price movement is directional and subject to trends. Contrary to the opinion of many non-traders, the market is not as chaotic as it might seem. And that is precisely what is stated in the above law. Due to the directionality of the price movement, it becomes possible to analyze, forecast and make successful trading decisions. If the market were really so chaotic, then there would not be many successful traders who are able to methodically make profits for a long time.
Understanding and competent use of such a basic concept as a trend is the first condition for the formation of a holistic vision of the market. A huge number of indicators, trading strategies or chart patterns are all based on fundamental concepts, knowledge of which is extremely important in order to fully exploit the potential of the above tools.
Having studied the features of the trend, a trader can successfully trade even without using complex indicators or intricate systems, which once again proves the importance of the basic principles in comparison with sometimes too cumbersome new methods.
Types of trend.
The market is unstable, it can be both extremely dynamic and very calm, but despite this, three most common conditions can be distinguished, each of which has its own characteristics and characteristics.
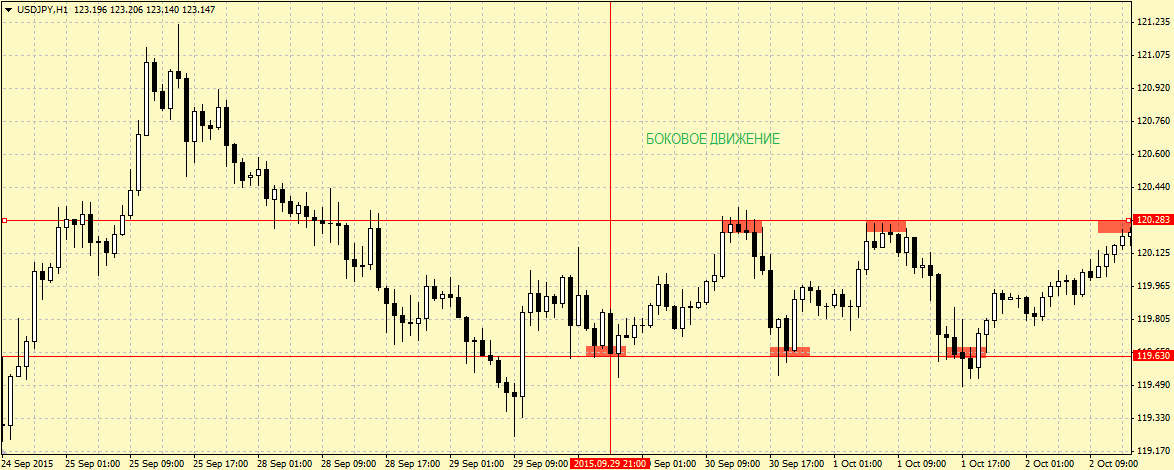
1. Lateral movement- this is a market condition in which the price of an asset changes within a small corridor, not rising above a certain maximum and not falling below any minimum value. It is necessary to understand that the most important part of any trend is the time interval in which the analysis is performed. For example, a sideways, calm movement will be observed on four-hour charts, but as soon as you go down a couple of time frames, the situation changes dramatically, and the market acquires dynamic and broad movements.
A similar state is characteristic of periods when there are a small number of traders on the market, as well as when the demand for an asset is low, which leads to a small dynamics of price changes. For this, the English language uses the word "flat", which means "flat, flat". The period when the price moves in such a narrow range is most favorable for scalping or calm trading.
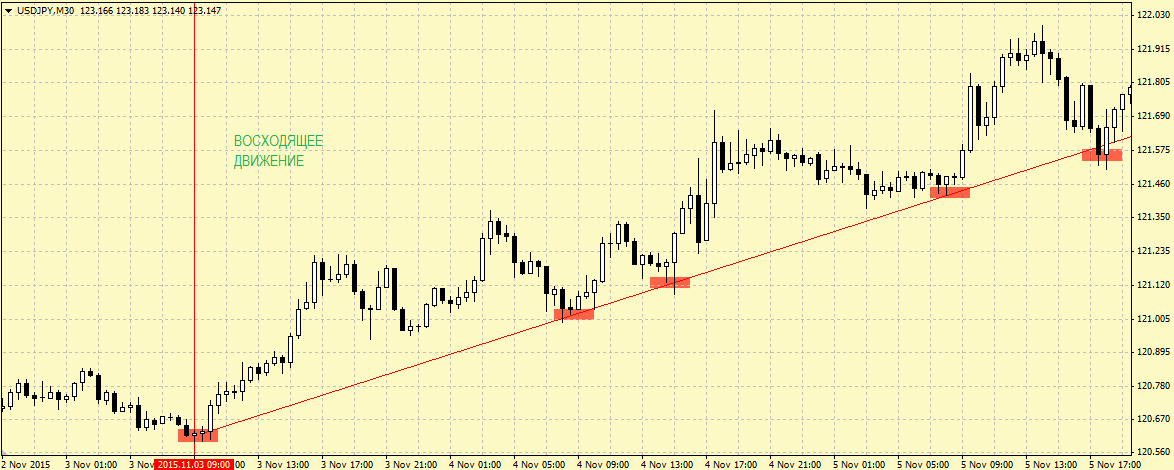
2. Upward movement- this is the dynamics of price changes, at which the value of each subsequent local minimum turns out to be greater than the previous one, as a result of which there is a clear progressive increase in the value of the asset. Visually, all the minimums (or most of them) can most often be located on a straight inclined line. This trend is also called “bullish”, comparing a rising price to a bull that attacks with its horns with a strong up and down toss.
The growing price symbolizes the favorable state of the asset, high demand for it, as well as a more optimistic view of market participants. Upward trends are typical for strong or strengthening currencies and stocks, which are supported by positive news, reports and other factors. When using a trend following strategy during this period, you should open buy trades, as the price is likely to rise in the future.
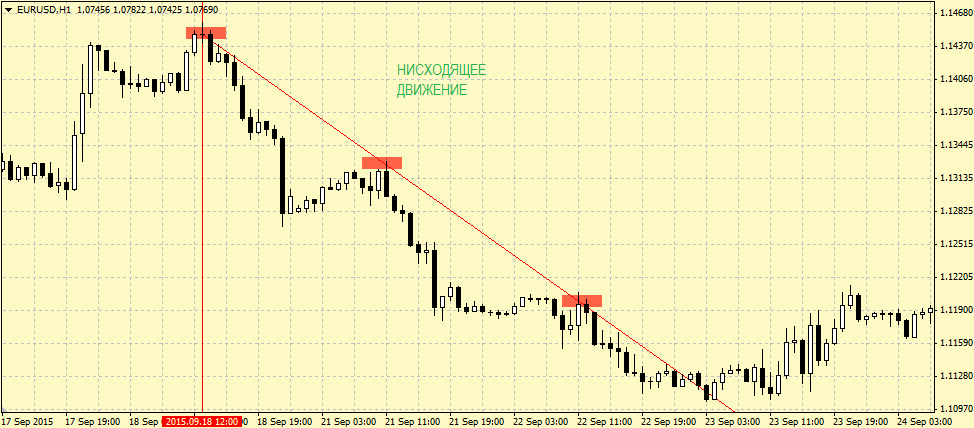
3. Downward movement- the dynamics of price changes, which is characterized by a sequence of local minimums, each of which is higher than the previous one. As with an uptrend, these local values can often be located on a single sloping line. Opposite to the upward, “bullish” trend, this type is called “bearish” because of the analogy with an attacking bear, which stands on its hind legs and with all its weight strikes with its front legs from top to bottom.
The fall in the value of an asset is the result of the manifestation of both individual economic, political or other factors, and the result of their cumulative impact. At such a time, it is worth following the market and opening sell deals, since the probability of success when choosing this direction will be significantly higher.
Trend characteristics.
A trend has several important properties, each of which can significantly affect its assessment as a whole. Determining the general direction of movement can be quite difficult, but it is much more difficult to form a more detailed picture on the basis of which you could open a profitable deal. The latter is a companion of experience, thanks to which a better sense of the situation comes, but in general it is enough to consider the 3 most important properties that form the basis of the trend:
1. Direction is the first and most important property. It is extremely important for beginners to understand the significance of scale in determining the trend, since the situation can be radically different at different time intervals. Because of this, a correction (the stage of a trend when the price stops moving in the original direction and returns a little back) can be perceived as an independent trend, which leads to wrong decisions. How to correctly identify the trend will be discussed below.
2. Strength - the more points exist through which a trend line can be drawn, the stronger and more important the current trend. It is also important to pay attention to the angle of the trend line: the steeper the degree of inclination relative to the horizontal, the less influential the movement. Those. very steep movements do not have the same strength as trends that develop relatively smoothly and for a long time. The ideal angle for upward and downward movement is 45 degrees.
3. Duration- the longer the trend exists, the stronger it is. This property is relevant for higher timeframes, since the price is extremely mobile and dynamic during the day. But at the same time, there are tactics that make it possible to use the global trend very effectively on a local scale.
Determination of the trend.
First of all, you need to remember one simple truth - there is nothing ideal in this world, and the market cannot be called such either. All definitions, schemes, connections are extremely conditional. Trading success does not depend on how well you memorized a definition, but on how deeply you understand the essence of the phenomenon in question. Your success depends on the ability to improvise, look at things outside the box and understand their imperfections.
Therefore, as an example for the study, we chose not the most ideal situation on the market. At the end of this paragraph, you yourself will see that a profitable trade does not always have to be perfect. So, let's consider the main stages of trend determination:
1. Local points- the first step is to determine the local minimums and maximums, which are available visually within a short time interval relative to the timeframe. If you have an open M30 chart, then you do not need to revise the entire previous month to determine the trend, choose a commensurate period. It is still better for beginners to use special graphical tools of the trading terminal (in this example, "Meta Trader"), and over time you can easily carry out all the procedures without them.
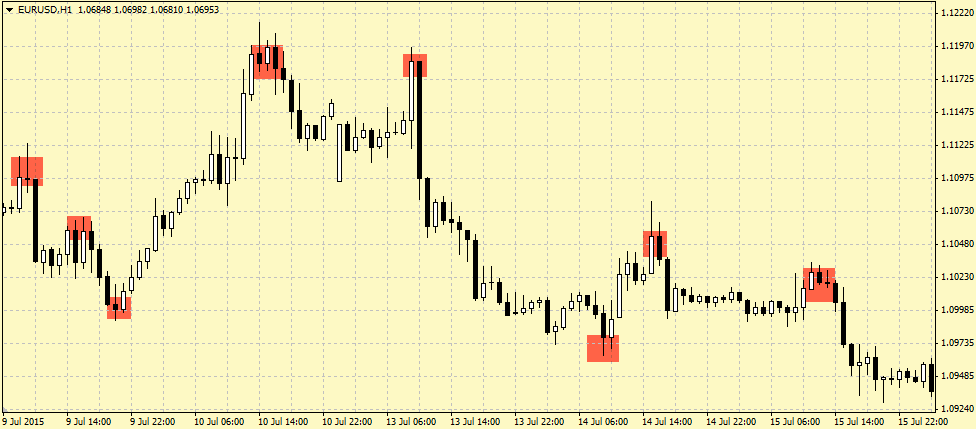
- now it is necessary to determine the dynamics by connecting as many minimums and maximums as possible with separate straight lines. Interestingly, with a pronounced trend, both will point in the same direction. With experience, this stage will be simplified to connect only one of the groups (highs or lows), depending on the trend. Also study the materials on the lines of support and resistance, as this is what you have built now. As a result, you have a trend line connecting the local price zones and indicating the vector of further movement.
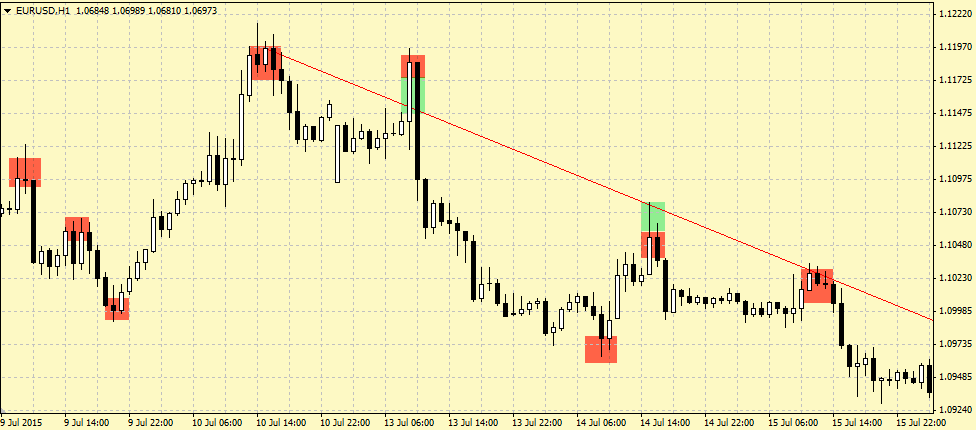
Surely many of you were surprised at how ugly the highs are connected. But, as mentioned above, the market is not ideal, which is why the construction of the trend line has its own characteristics.
The line doesn't have to connect all the points perfectly. Moreover, the generally accepted definition of a "trend line" is not entirely correct. It is more appropriate to talk about a trend zone or area, which is formed at a distance of several points from the line in both directions. The price will never retrace from the line you have drawn up to a point, and this is extremely important to understand. It may not reach several points during the correction, make a false breakout of the built level, or not approach it at all, sharply rushing in the right direction without any rollbacks back.
One of the subtleties of building a trend line is knowing the exceptions. Such an exception is the concept of a false breakout, which can be described as an unsuccessful (but sometimes extremely convincing) attempt by the price to break through the existing level and reverse the direction of its movement. Without going into details, in the above example, this is exactly the case: the price broke through the line with a jerk and closed above it, but the next candlestick returned the market with an even larger jerk and closed significantly below the line, while maintaining its value ...
Also, the situation when the price does not reach the line has its peculiarities. Many traders consider it correct to connect only candlestick bodies (the gap between open and close), and not shadows (maximum and minimum values) when building a trend. This is true for the base (extreme) points, but it is permissible to “capture” some intermediate (internal) stages along the upper parts of the candles. In addition, this can be explained by the insufficient strength of traders trading against the current trend, which further confirms its importance.
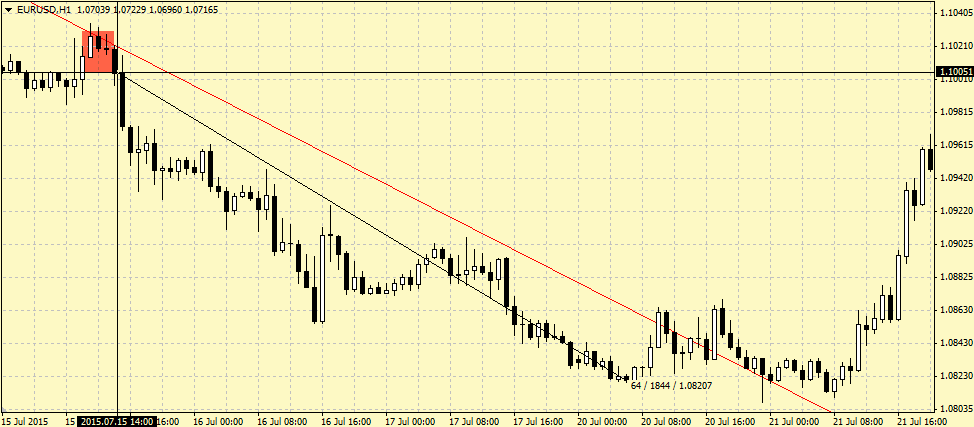
Looking a little further in the direction of the trend, you can see a very pleasant picture. By constructing such an imperfect trendline and opening a trade on the last touch, it would potentially be possible to get a very good profit (based on the maximum calculation of the distance traveled), since the price obediently went in the right direction, without even trying to test or break the trendline.
Application.
The trend can be used as an independent phenomenon, without relying on additional tools, but you can try to reveal the hidden potential using a variety of techniques and methods.
The most popular is to use the trend as a fundamental part of chart analysis. You can use simpler (in terms of logic) methods, such as trading from support and resistance levels, or delve deeper into the study of the variety of chart patterns and patterns. The use of these techniques requires certain skills, such as: photographic memory, the ability to identify organized price patterns from a multitude of separate movements, perseverance. Skillful use of your abilities, as well as the advantages of graphical analysis, can lead to tremendous success.
The second option for using the trend is trading using technical indicators. There is even an item in the Meta Trader terminal that contains some of the instruments of this group. To insert them, you need to follow the "Insert - Indicators - Trend" path. But, despite the seeming simplicity, this method requires no less effort and skill.
You can often hear about various combinations of elements of graphical analysis with indicator. And it has a right to life. As already mentioned, one of the most important success factors is the ability to improvise and look at things outside the box. It is not possible to consider even in general terms all the methods of trading using the trend within the framework of this material, but now you have a basis, and it is up to you to decide which direction to go into.
Conclusion.
The age-old dream of any trader comes down to knowing what will happen to the market in the future. Complex mathematical calculations, oscillators and indicators, trading systems that turn a blank sheet of a price chart into the canvas of some crazy artist ... All this for one single purpose - to look into the future and make the right choice now.
Graphic analysis with its rich history has not receded into the background, has not lost its relevance in the age of the total prevalence of computer technology and mathematical sophistication. Its accessibility and simplicity prompts some to say that all this has not worked for a long time, that this method of analysis has outlived its usefulness and should give way to more modern, fresh methods. But classical graphical analysis still regularly brings profit to traders all over the world, while its opponents invent the next formula, analyze data sets and try to create something perfect by trial and error.
Understanding trend movements, independently building relationships, analyzing and making decisions based on your thoughts, and not the result of mathematical calculations - all this has a soul, no matter how silly or pathetic it sounds. Maybe all this really is a thing of the past, and very soon an order of magnitude more perfect trading methods will be found. Perhaps. But what is really worth doing is to start your journey by working more closely with the trend, while gaining the precious experience of observing all the frenzy of the market.
