What does the word trend mean and how to make money with it?
Greetings, subscribers and guests! Remember your school days? We were told then: "Repetition is the mother of learning." Sometimes it's good to look back and brush up on what you've learned before.
Moreover, our friendly team of traders and investors is constantly replenished. Today let's remember what the word trend means and what trends are.
English word trend translated into Russian as a trend. It is in this sense that it is familiar to almost every adult with an average outlook. For example, in fashion, the word "trend" means the latest trends, the style that is popular this season. “To be in trend” means to dress in fashion, follow the latest music and movies.
In the exact sciences, the word "trend" means a regular change in some parameter depending on time. This change may have a bizarre shape, but in any case, it can be described by some function. Otherwise, it is no longer a trend, but an array of random numbers.
In economics, a trend is a long-term direction in which statistical data on some economic indicator changes. At the same time, this regularity may not manifest itself at short-term intervals. Statistical methods used in the processing of numerical data allow you to filter out random values and identify a general trend, if any.
On the stock exchange, the definition of a trend, perhaps, can be considered the most obvious. In terms of meaning, it coincides with the definition adopted in economics, but is supplemented with important details. First of all, there are 3 types of stock trend:
- Bullish
- Bearish
- Side
Let's play associations
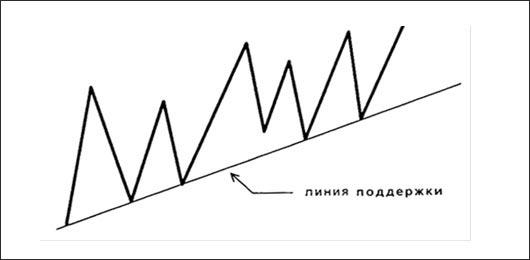
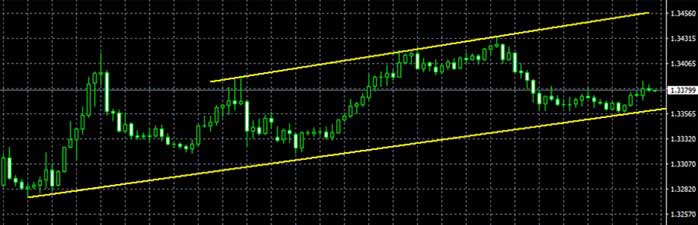
On the stock exchange and in forex, visual ones are accepted. Bulls raise the price of the horns, push it up. Therefore, a bullish trend is characterized by a consistent growth of local lows and highs of the price. For clarity, a line is drawn through local minima, called the support line. As long as the price is above it, the bullish trend is in force.
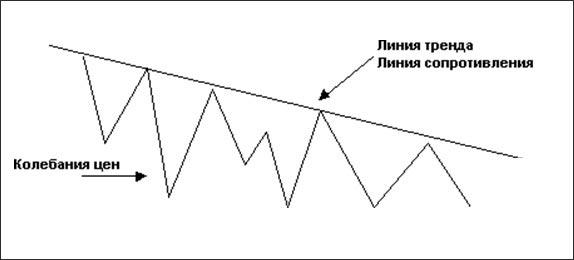
A similar principle is used to determine a bearish trend (bears push the price down with their mass). It is characterized by a consistent decrease in local highs and lows of the price:
Finally, a sideways trend is such price behavior when local highs and lows do not go beyond the horizontal channel:
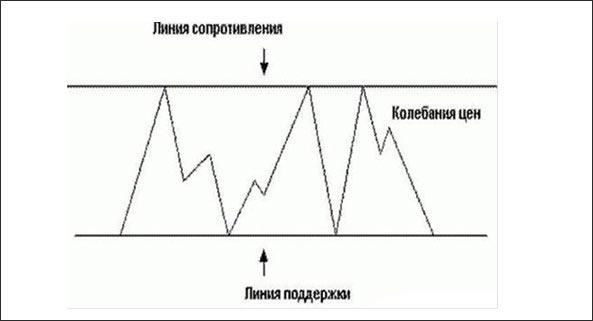
A sideways trend is sometimes called a flat. flat- straight, flat). It is not always possible to draw both lines on the chart. At the same time, for a bullish trend, the support line is more important, as a guideline for continuing growth, starting from each new low, and for a bearish trend, the resistance line. These lines are called trend lines.
Various experts in the technical analysis of the market offer their own, slightly different methods of building them. This is because over time, the trend can accelerate, slow down, or shift to the side.

For example, on a bearish trend, the price can break through the support line, go down, but then resume growth again. The line, which previously acted as support for the price, may become a resistance line.
The situation when the price breaks through the support or resistance line and makes a series of touches of this line from the other side (tests the trend line) is ambiguous in terms of determining the direction of the trend.
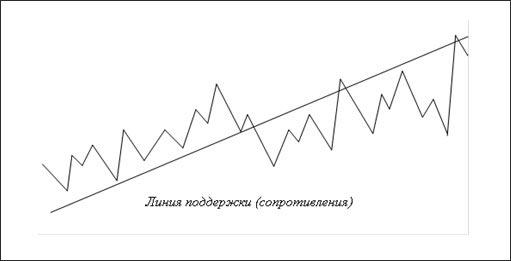
In this figure, after breaking through the support line, the local highs resumed growth, but the lows have already begun to turn down. This could be a sign of a bullish to bearish trend reversal.
Is there a trend in the market, and if so, how to determine it? You can draw trend lines on any chart using at least 2 local price highs and lows.
The problem is that the trend that is present in a given time frame can be bullish, and on a larger and smaller one it can be bearish. Accordingly, there will be completely different conclusions and recommendations for the trader.
For example, a buy signal will be received for a chart of one scale, and a sell signal for another. There is no contradiction here: it's all about the trading strategy. If, for example, he is looking for an opportunity to buy, then, on the contrary, he will see an excellent opportunity to sell.
In Forex, in addition to building trend lines, additional methods of analysis are often used, for example, indicators. This is due to the fact that forex usually uses more risky and aggressive trading strategies than stock exchanges. Such strategies require a very precise definition of the current situation in order to successfully enter a trade.
Afterword
Why is it so important to know what a trend is and how to identify it? There is a catchphrase that is useful for all traders and investors to learn: trend is your friend, which means: the trend is your friend. Indeed, why swim against the current when you can trust it? Therefore, if you have not yet subscribed to my blog updates, it's time to do it to always be in trend!